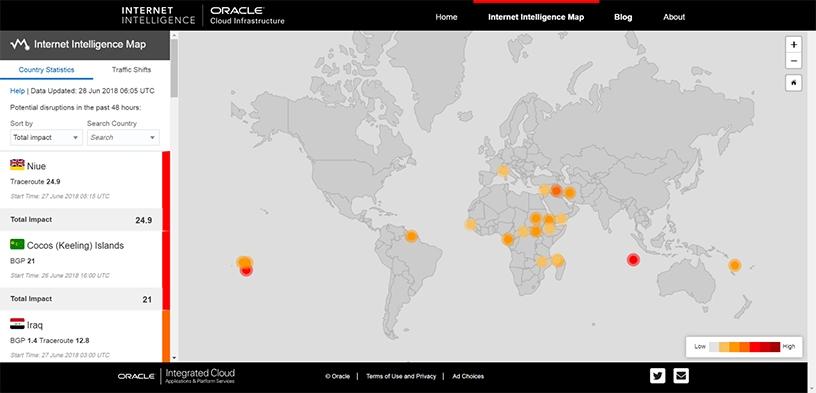
Oracle has announced the availability of an Internet Intelligence Map, providing the public with a graphical way to track the health of the global Internet.
The online map enables users to extract insights on the impact of natural disasters, like storms or earthquakes, as well as state-imposed interruptions or technical faults.
"The Internet is the world's most important network, yet it is incredibly volatile. Disruptions on the Internet can affect companies, governments and network operators in profound ways. As a result, all of these stakeholders need better visibility into the health of the global Internet," according to Kyle York, VP of product strategy for Oracle Cloud Infrastructure.
For over a decade, the members of Oracle's Internet Intelligence team (first born as Renesys, more recently Dyn Research) have helped to break some of the biggest stories about the Internet.
"From the Internet shutdowns of the Arab Spring, to the impacts of the latest submarine cable cut, our continuing mission is to help inform the public by reporting on the technical underpinnings of the Internet and its intersection with, and impact on, geopolitics and e-commerce," says Doug Madory, director of Internet analysis for Oracle Cloud Infrastructure.
The free online map presents country-level connectivity statistics based on traceroutes, Border Gateway Protocol (BGP), and Domain Name System (DNS) query volumes on a single dashboard. By presenting these three dimensions of Internet connectivity side-by-side, users can investigate the impact of an issue on Internet connectivity worldwide.
"It's important to have a global view of the Internet in order to understand how external events prevent users from reaching your Web-based applications and services. It is only when you have this insight that you can work around those issues to improve availability and performance," says Jim Davis, founder and principal analyst of Edge Research Group.
Country view
The Web site has two sections: Country Statistics and Traffic Shifts. The Country Statistics section reports any potential Internet disruptions seen during the previous 48 hours. Under this section, users can search for a specific country, or look at a global overview of where affected areas are at the moment. When searching South Africa, the map showed this morning the total impact on the Internet in SA was zero in the past 48 hours.
In Africa, however, there were a number of countries showing impact to their connectivity this morning; in fact, the majority of impacted countries were in Africa. Those showing issues included Eritrea with a total impact of 9.8, Equatorial Guinea with 2.2 impact, South Sudan at 1.6 and Sudan at 1.2. Those showing low impact included: Guinea-Bissau with a total impact of 0.8, Malawi at 0.7, and Ethiopia and the Central African Republic were both showing an impact of 0.1.
Two islands off the African coast were also experiencing issues: worst hit was the French island of Mayotte with a total impact of 8.1 and nearby island nation Comoros with a minor impact of 0.1.
Hardest hit globally this morning was the South Pacific island nation of Niue, which had a total impact rating of 24.9; and the Cocos (Keeling) Islands, a remote territory of Australia in the Indian Ocean, with an impact rating of 21.
There were also some Middle Eastern countries experiencing Internet issues today. Iraq had a total impact of 14.2, neighbour Iran's impact was at 5.9, Yemen had an impact of 1 and Lebanon had a low impact of 0.7.
Suriname in South America was showing a total impact of 6.8, the island nation of Vanuatu in the South Pacific Ocean was showing a total impact of 3.6, and the European principality of Monaco also had a low impact of 0.5.
In terms of the Traffic Shifts section, researchers have coloured the indicators blue on the map because they aren't necessarily outages or connectivity impairments, they are simply how traffic is being routed through the Internet. Researchers say that on any given day, there are hundreds of such shifts as Internet service providers change transit providers or re-engineer their networks. The tool enumerates the top 100 shifts in the previous 48-hour period and allows users to explore a macro-level connectivity picture for any given autonomous system.
Interpreting the
The Internet Intelligence Map rates Internet impact based on three things: traceroute completions, BGP prefixes and DNS queries. The total impacts mentioned above are simply sums of the three independent impact scores.
As part of the Internet measurement infrastructure, Oracle's Internet Intelligence team runs millions of traceroutes per day to all parts of the Internet from hundreds of globally distributed measurement servers. The impact on the traceroute completion ratio highlights instances where the number of observed responding traceroutes drops below a historical baseline.
"A drop-off in observed responding traceroutes suggests connectivity impairment that could be caused by either a technical failure (eg, a power outage or fibre-optic cable cut) or a deliberate act (eg, a government-directed Internet blackout)," the Web site explains.
Researchers tend to emphasise the traceroute impact metric as they have determined that this measurement most reliably detects large-scale, country-wide impairments of Internet service.
However, there is a second tracking method, BGP, which is the mechanism by which entities such as Internet service providers, commercial enterprises and universities exchange information on how to reach ranges of Internet Protocol (IP) addresses or prefixes. Most BGP prefixes can be geolocated to a single country. The total set of BGP routes for a country defines how the IP addresses of that country are reached over the Internet. When Internet outages occur, they are often accompanied by drops in the routed BGP prefixes seen in the global routing table.
Unlike BGP and traceroutes, DNS queries are generated during the course of typical Internet usage, often by end-users as they surf the Web. As such, the volume of queries over time exhibits a predictable daily or diurnal pattern. If the volume of queries deviates from this pattern, this can be a useful indicator that something has happened to Internet usage in a geography, researchers explain.
Share